There’s no question about it: You have a wealth of insights at your fingertips.
Each time a user interacts with your brand, that’s a data point. And if you’re taking time to do the worthwhile activity of social media competitor analysis, the same can be said of users’ interactions with your competitors.
Having access to all this data creates a problem, though.
- How do you sift through so much of it to notice trends, spot patterns, and draw actionable insights?
- And your team, manager, or clients would be frightfully bored by a twenty-minute, statistic-filled explanation. How to present your findings to them in a way that is appealing, understandable, and persuasive?
If you want to leverage the insights you’re gathering and use them to make quicker and smarter decisions, social media data visualization is the answer.
Let’s look at the concept deeper.
What is Social Media Data Visualization?
Data visualization is taking complex, varied datasets and presenting them visually.
When we speak of social media data visualization, we’re simply applying this concept to the data you gather from—that’s right!—social media. Examples are your follower growth rate, your content performance metrics, competitor performance, etc.
If all this is a bit abstract so far, don’t sweat it. We’re getting into examples and illustrations just now.
Common Types of Social Media Data Visualization
Certain visual aids work better than others for presenting different types of data. We’ve outlined a few below, along with the type of data they’re best suited for.
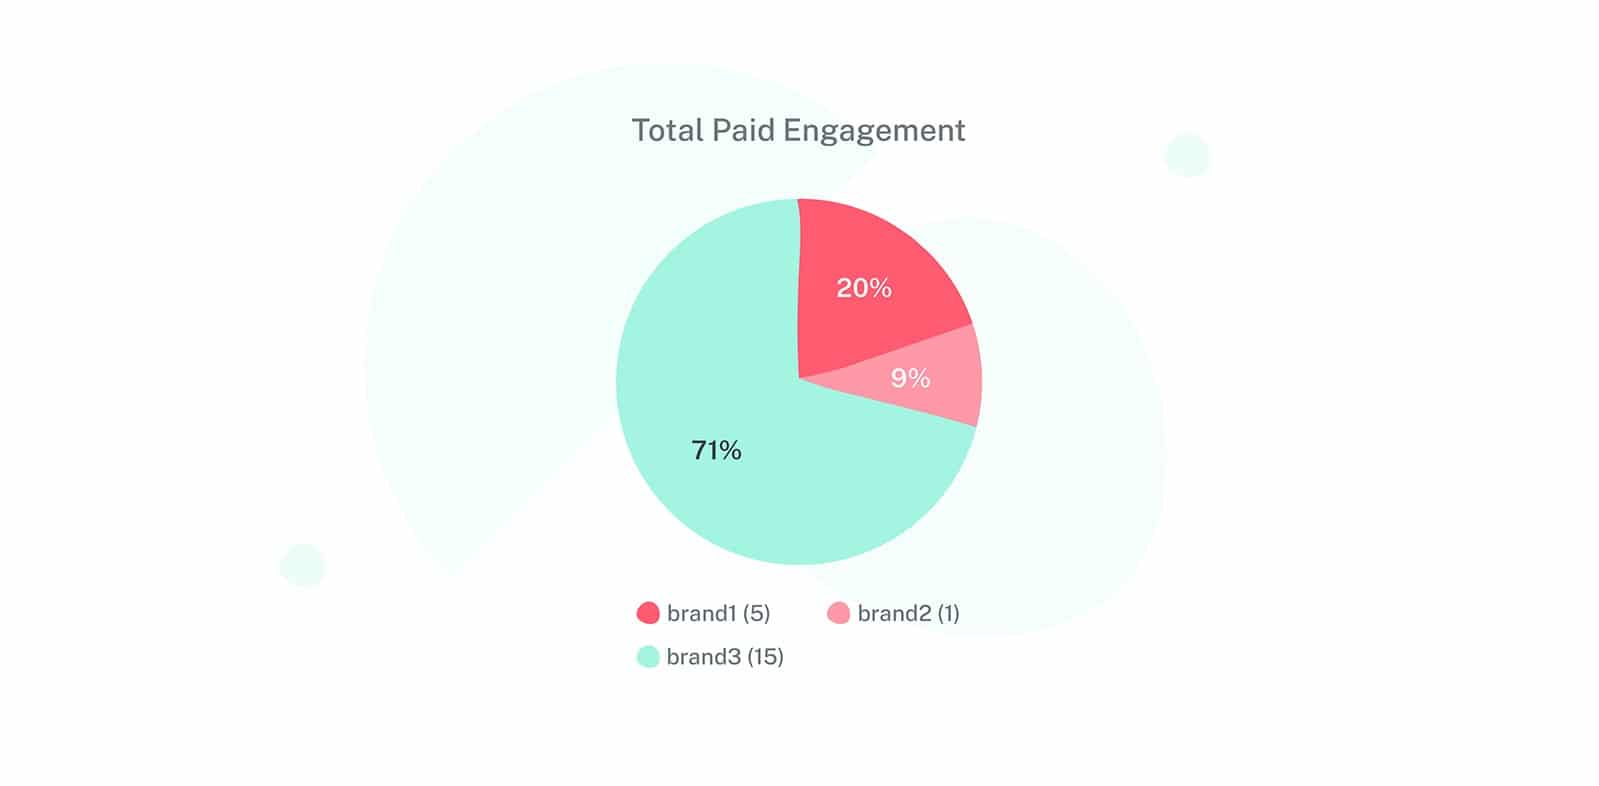
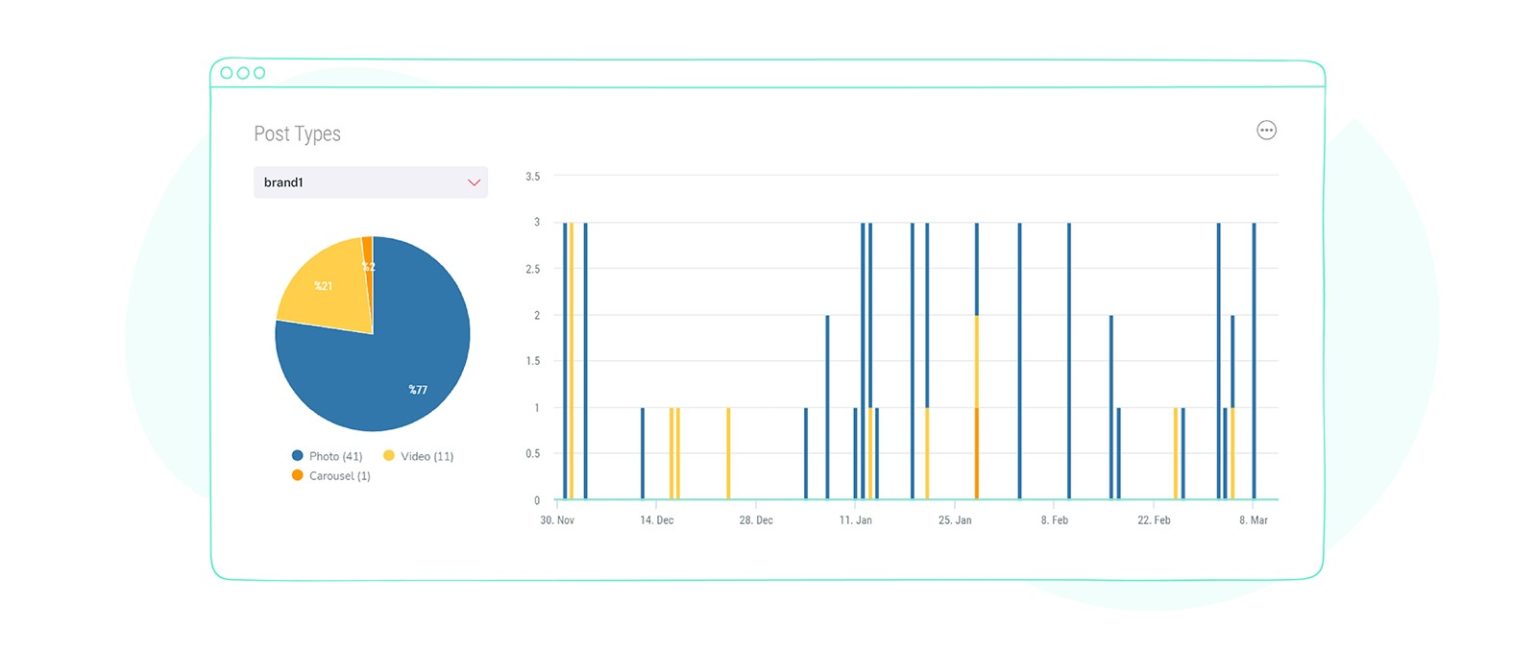
Pie charts
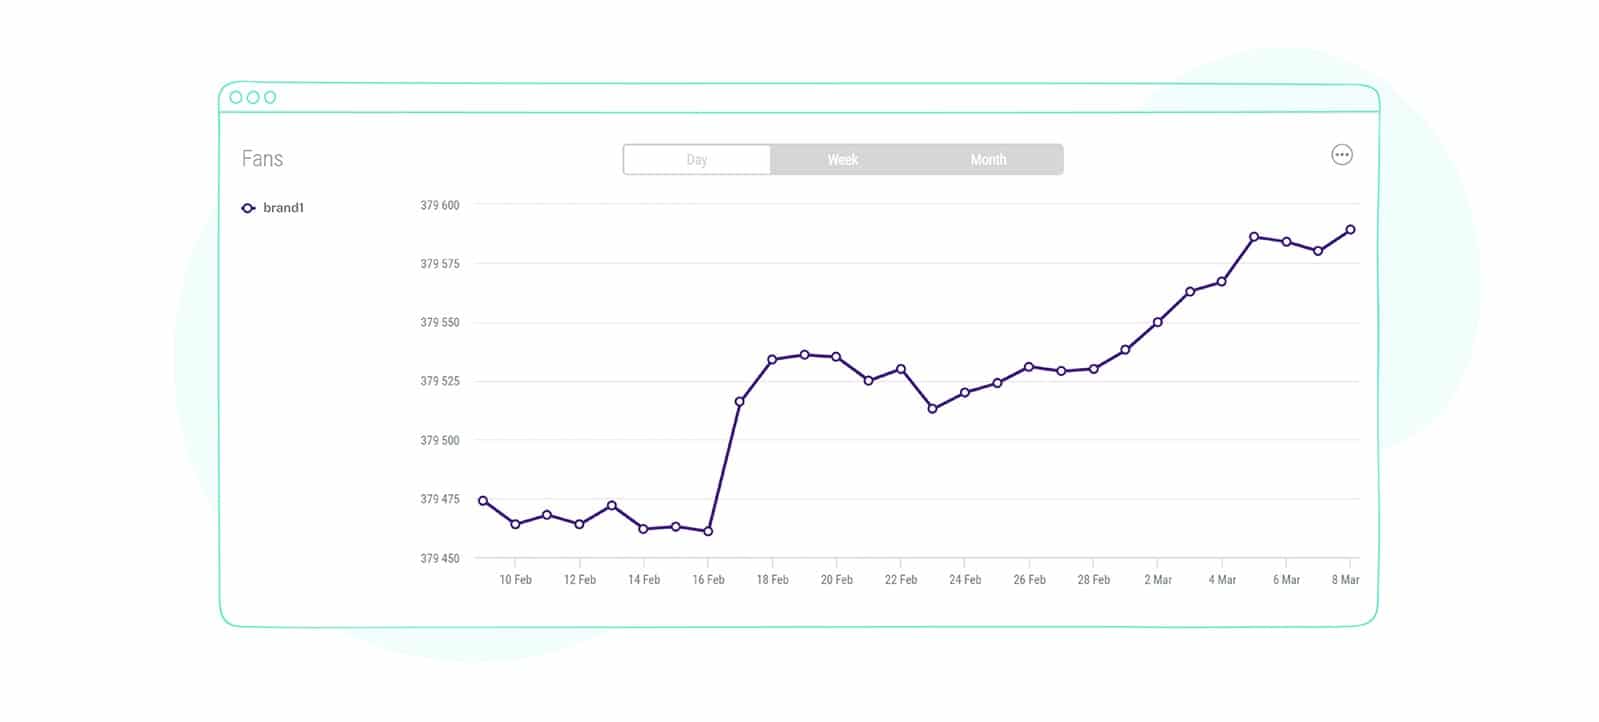
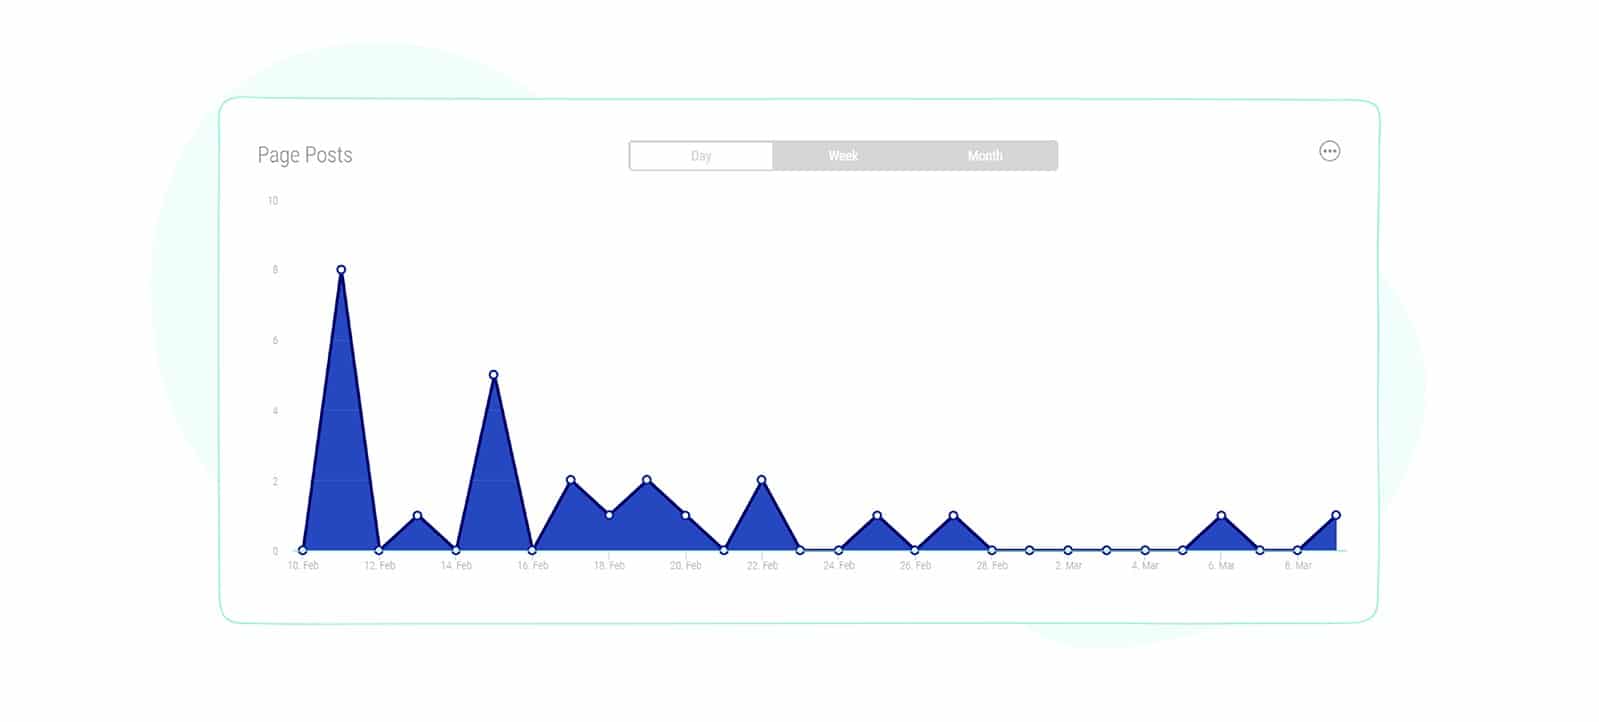
Line Charts and Area Charts
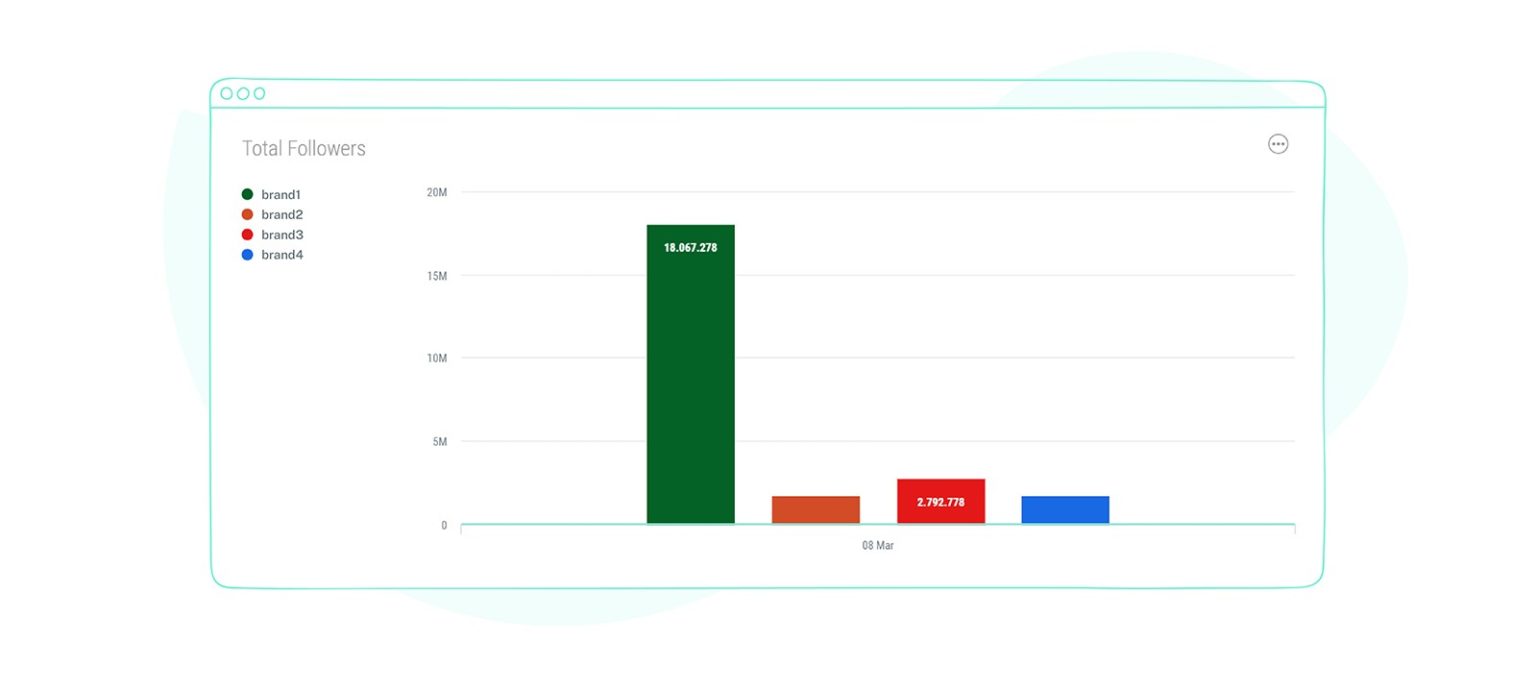
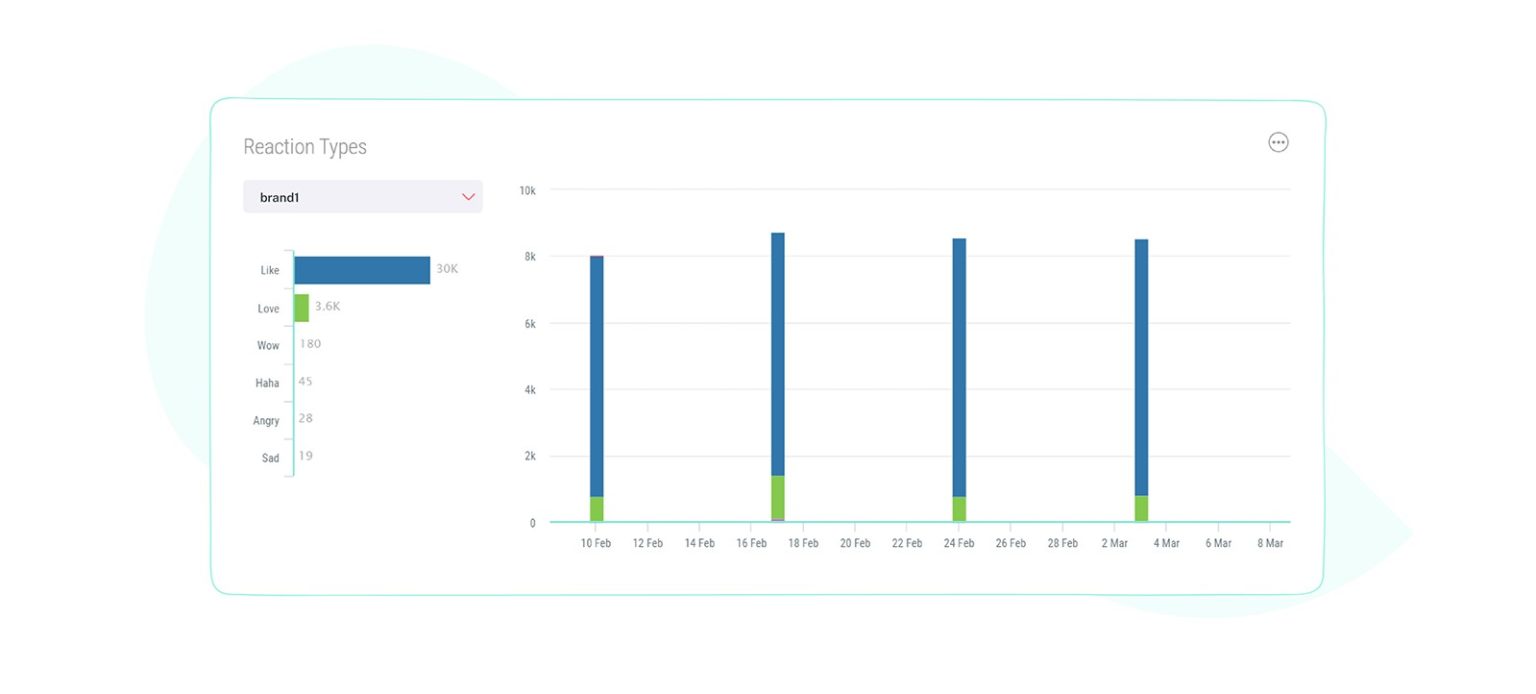
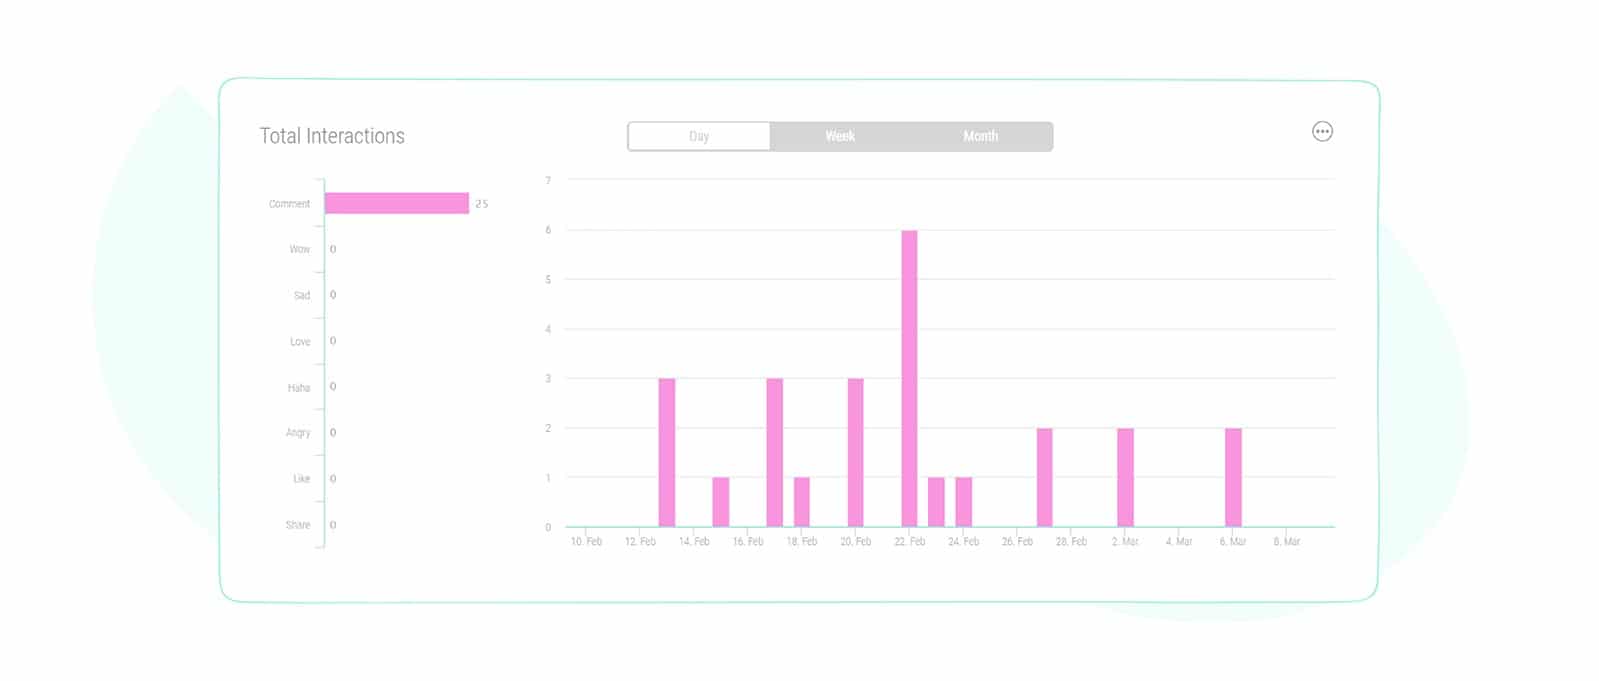
Bar Charts
Histogram
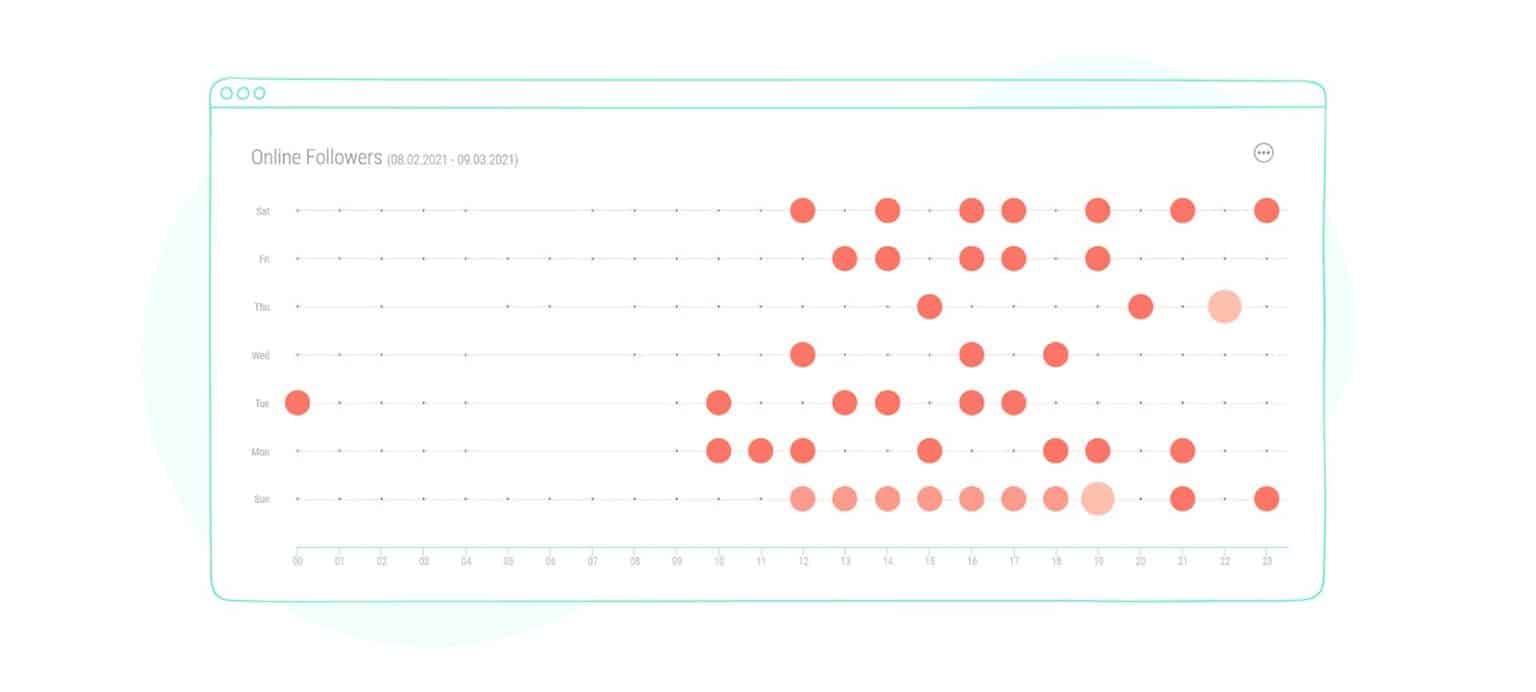
Scatter Plots
Advantages of Social Media Data Visualization
Now that you know the different types of social media data visualization let’s look at exactly how they empower intelligent decisions. We’ll also highlight advantages that they can bring to how you manage your brand’s social media accounts.
1. Comprehensive Trend Spotting and Analysis
As you’ve seen, social media data visualization makes it easy to instantly see how two or more factors relate. Imagine having to look at all those data points separately, comparing them at each turn, and then trying to explain them. Not only does that lengthen your decision-making, but it puts you at risk of focusing on the wrong datasets and making errors in your analysis.
A McKinsey Global Survey reveals that only 20 percent of marketers are satisfied with their decision-making. With data visualization, you can avoid being part of the rest. Visualizing your social media data makes it much easier to see if there’s anything to gain from a type of analysis before you spend too long on it.
And where there’s a helpful insight tucked into the data, following it with the help of visual aids makes for far simpler yet more powerful and accurate analysis.
2. Quicker Decisions
Picking out the right information and identifying trends is crucial for all aspects of your brand’s social media. That includes your publishing schedule, the content you post, how you engage with users, and how performance stacks up against competitors.
As the illustrations show, social media data visualization makes this process much quicker. You can spot patterns at a glance, with the ability to peer into the hard numbers behind them if you need to.
Especially when you have time-critical opportunities to leverage or mishaps that are looming if you don’t change course in time, spotting and acting on trends quickly is often vital to the success of your campaigns.
3. Effective Presentation
Given all that goes into managing social media accounts, you most likely don’t have the time to explain trends and patterns to your team, your boss, or your clients. To be fair, they probably don’t have the patience either.
After visualizing your social media data, you can share it in ways that are appealing. And that’s essential, especially when you have to get buy-in and approval for any strategic changes you’re thinking of making. If your idea is well-founded and the data backs it, isn’t it best that everyone sees your point and gets on board?
The intuitive presentation you achieve with data visualization helps make that easier. As the Wharton School of Business found, a verbal presentation is likely to convince half an audience, but one with visuals can convince over two-thirds. Whomever you need to inform or convince can see roughly where the data leads immediately after seeing your graph or chart, with more exact insights open to them with closer inspection.
4. Increased Understanding Over Time
Going through text and number-packed documents or even Excel sheets is tedious and time-consuming. But historical data is essential for you to broaden your understanding of your audience. When planning for events like Black Friday, Valentines’ Day, and other holidays that are relevant to your brand, your past experiences and those of your competitors can lend you helpful context. The same applies to your ordinary, day-to-day tactics.
With visualization, this data isn’t intimidating or boringly off-putting to dig through. Instead, it’s intuitive, well-presented, and simple to draw insight from. An archive of visually-driven reports compels you to go through it whenever the need arises, meaning you can always draw critical lessons from the past to inform your decisions.
Tips for Social Media Data Visualization
Now that you know the different types of data visualization for social media and what they can offer you take these tips on maximizing the value you get from the process.
Tip 1: Use the Right Tools
You don’t have to be a designer or a pro statistician to visualize your social media data for more intelligent decisions. It simply takes having the right tools.
Ideally, you want all the data scrapped and visualized for you automatically. You save time that way. Sociality.io’s report module has this functionality, along with other features that make visualizing your data more effectively.
Another visualization tool worth its salt is Tableau. There’s a wide variety of data visualization types available, but be careful not to go overboard or get too fancy and lose your message.
You’ll also need to keep in mind that you’ll need to pore through and input the relevant data yourself, so the efficiency and time-saving factor is slightly diminished.
Tip 2: Focus on the Right Data
As stated, there’s plenty of data for you to turn into appealing, insightful, and digestible diagrams. But you’ll need to be careful what you pick. Stick to what’s relevant to your strategy and what will effectively communicate the message you’re trying to put across.

If you’re trying to show that your brand’s current strategy is outperforming competitor initiatives, having several competitors on the visual can add emphasis. But if your point is clear enough with a few or just one competitor, the rest of the data points may just be clutter that obscures the message.
The important thing is to keep your visuals tidy and to-the-point, with a key focus on the factors that demonstrate increased ROI opportunities for your brand.
Tip 3: Get Automatic Reports with Your Social Media Data Visualized
Apart from having the data visualized automatically, receiving it with the same ease and effortlessness is also a huge time-saver. Luckily, you can do just that with automatic reports. Simply set the frequency, format, and who else on your team you’d like to receive the report.
This makes it possible for you to have a constantly updated overview of how your brand and your competitors perform in real-time without sacrificing hours.
Plus, you can have the report sent to you in the format that suits your purposes best. For a presentation you plan to make, that can be PPT. And for circulating it among your team or sharing it with clients, PDF may be the right fit.
In Closing…
Social media data visualization is an effective way to level up how you use all the data within easy reach. The neat and clear but information-rich presentation enables you to perform more meaningful analysis and make informed, intelligent decisions that move the needle for your brand.
Best of all? You don’t have to lift a finger to sift through, organize, and input the data.
You can view it straight on a clean, smoothly navigable dashboard. And you can export it in various formats for sharing and to empower smarter decisions team-wide. Visualize your social media data and bring true insight and clarity to the heart of your decision-making process.
FREE AI-Powered 1-Page Inbound Marketing Plan

